Richest Cities in Connecticut (2026)
by Kristen Carney
Updated: February 9, 2026
Richest City in Connecticut
The richest city in Connecticut is Darien with an average household income of $455,057 as of 2024 and 21,936 people as of 2024 according to the most current Census data available (citation).
| Rank | City | County | Population | Average Income | Median Income |
|---|---|---|---|---|---|
| 1 | Darien | Western Connecticut | 21,936 | $455,057 | $250,001 |
| 2 | New Canaan | Western Connecticut | 20,870 | $414,531 | $250,001 |
| 3 | Greenwich | Western Connecticut | 63,856 | $376,402 | $206,130 |
| 4 | Westport | Western Connecticut | 27,528 | $370,746 | $250,001 |
| 5 | Weston | Western Connecticut | 10,396 | $366,350 | $250,001 |
| 6 | Wilton | Western Connecticut | 18,777 | $335,446 | $242,199 |
| 7 | Easton | Greater Bridgeport | 7,670 | $270,983 | $222,604 |
| 8 | Ridgefield | Western Connecticut | 25,109 | $252,057 | $179,219 |
| 9 | Goshen | Northwest Hills | 3,196 | $248,319 | $152,093 |
| 10 | Redding | Western Connecticut | 8,780 | $243,765 | $186,060 |
| 11 | Fairfield | Greater Bridgeport | 63,416 | $238,230 | $172,432 |
| 12 | Lyme | Lower Connecticut River Valley | 2,303 | $227,835 | $135,000 |
| 13 | Bridgewater | Western Connecticut | 1,658 | $226,111 | $159,365 |
| 14 | Woodbridge | South Central Connecticut | 9,073 | $224,274 | $188,750 |
| 15 | Roxbury | Northwest Hills | 2,185 | $223,128 | $123,864 |
| 16 | Sherman | Western Connecticut | 3,554 | $221,741 | $116,000 |
| 17 | Avon | Capitol | 18,946 | $219,080 | $154,058 |
| 18 | Monroe | Greater Bridgeport | 18,949 | $216,662 | $157,250 |
| 19 | Madison | South Central Connecticut | 17,616 | $214,119 | $167,442 |
| 20 | Bethany | South Central Connecticut | 5,288 | $209,992 | $166,236 |
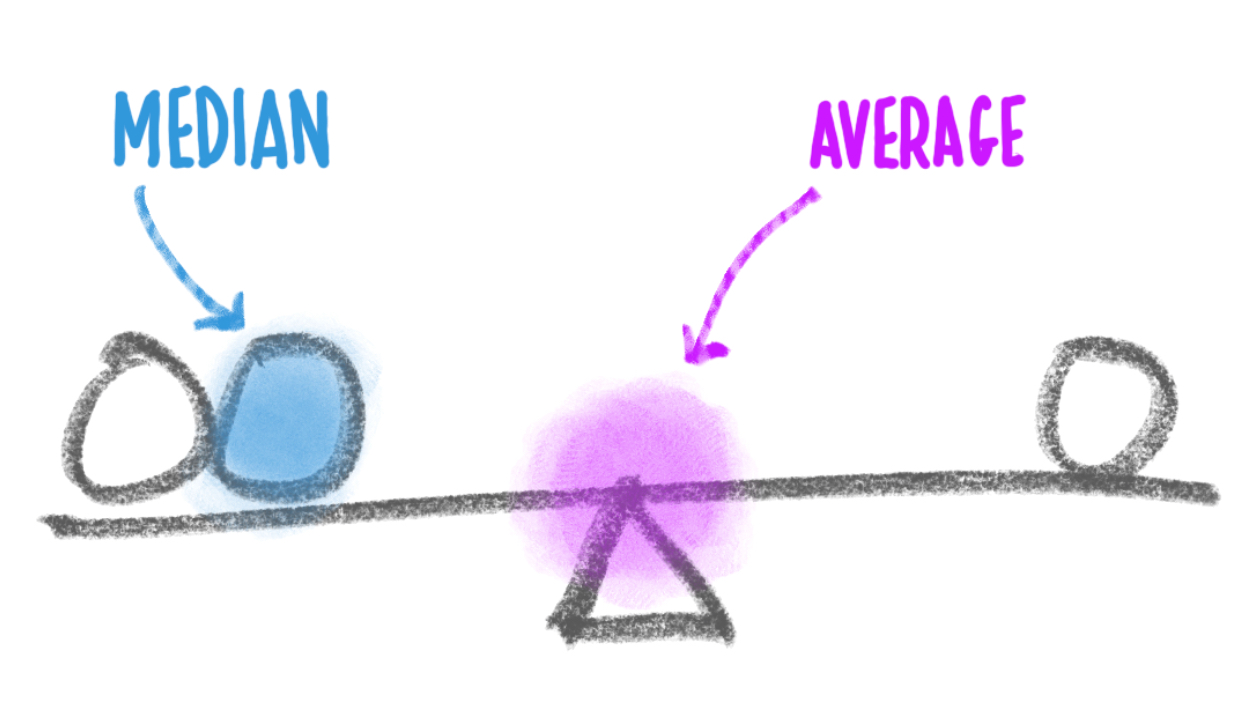
Median Income versus Average Income: Which Should You Use?
We usually suggest using median income data – either instead of or in addition to – average income data as a true indicator of wealth. If you haven’t thought about median versus average since your last standardized test, you aren’t alone. Here’s what they are:
- average is the sum of a set of numbers divided by the count of numbers in the set
- median is the middle number in the set of numbers
Now let’s say you had the following simplified set of income data.
Household 1: $30,000
Household 2: $50,000
Household 3: $1,000,000
The average income for this set is $360,000. The outlier data point ($1,000,000) skews the average WAY up. Conversely, the average income would be skewed WAY down if someone had an income of $500. The median income for the same data set is $50,000. Outlier data doesn’t skew the median.
Most Business Owners Should Use Median Income
So most business owners should use the median income as a true indicator of wealth, because it provides a more accurate representation of a typical income, especially in areas with significant income disparity.
When Should You Use Average Income
If your target market is high-income households, the average income may be more relevant. This is because the average income can highlight the presence of a higher concentration of wealthy individuals, which is beneficial for luxury goods and services marketing. We’re using average income on this page because using the Census’s highest reported median value of $250,001 could result in multiple ties for the richest geography.
Why do so many cities have a median value of $250,001?
The Census' American Community Survey uses $250,000+ as a jam value for median income estimates to protect privacy, ensure data consistency, and simplify reporting. A "jam value" in survey data refers to a placeholder or default value used when actual data points are unavailable, incomplete, or exceed certain thresholds. We represent this jam value as $250,001 to make it easy for you to sort.
You might also be interested in:
Email Me When New Data Are Released
Join thousands of subscribers and receive just 1 (ONE!) email a year in December when the US Census Bureau releases new income data for Connecticut richest cities.
SOURCES
United States Census Bureau. Annual Estimates of the Resident Population: April 1, 2020 to July 1, 2023. U.S. Census Bureau, Population Division. Web. May 2024. http://www.census.gov/.
United States Census Bureau. B01001 SEX BY AGE, 2024 American Community Survey 5-Year Estimates. U.S. Census Bureau, American Community Survey Office. Web. 29 January 2026. http://www.census.gov/.
United States Census Bureau. B19013 Median Household Income, 2024 American Community Survey 5-Year Estimates. U.S. Census Bureau, American Community Survey Office. Web. 29 January 2026. http://www.census.gov/.
United States Census Bureau. "DP03 SELECTED ECONOMIC CHARACTERISTICS." 2024 American Community Survey 5-Year Estimates. U.S. Census Bureau, American Community Survey Office. Web. 29 January 2026. http://www.census.gov/.
Products & Services
Plumbing
Connect
- 1-800-939-2130
- Contact Us
© Copyright 2026 Cubit Planning, Inc.